

Maha Elouni: Unsnarling traffic for a less frustrating future
This story was written in the spring of 2020 by GRAD 5144 (Communicating Science) student Jeremy D. Hansford as part of an assignment to interview a classmate and write a news story about her research.
Friday afternoon I left my office in Blacksburg, Virginia, at 4:54 p.m. to get to Roanoke before a certain shop closed at 6:00 p.m. As I sat in my vehicle on Main Street, I kept hoping to get through all the traffic lights before 5:00 p.m., when Blacksburg’s streets become a gridlock nightmare. I knew Interstate 81 North could also easily be awash with traffic. Waiting at the third red light in a row, frustrated by the uneven flow, I thought, “If only someone could fix this mess!”
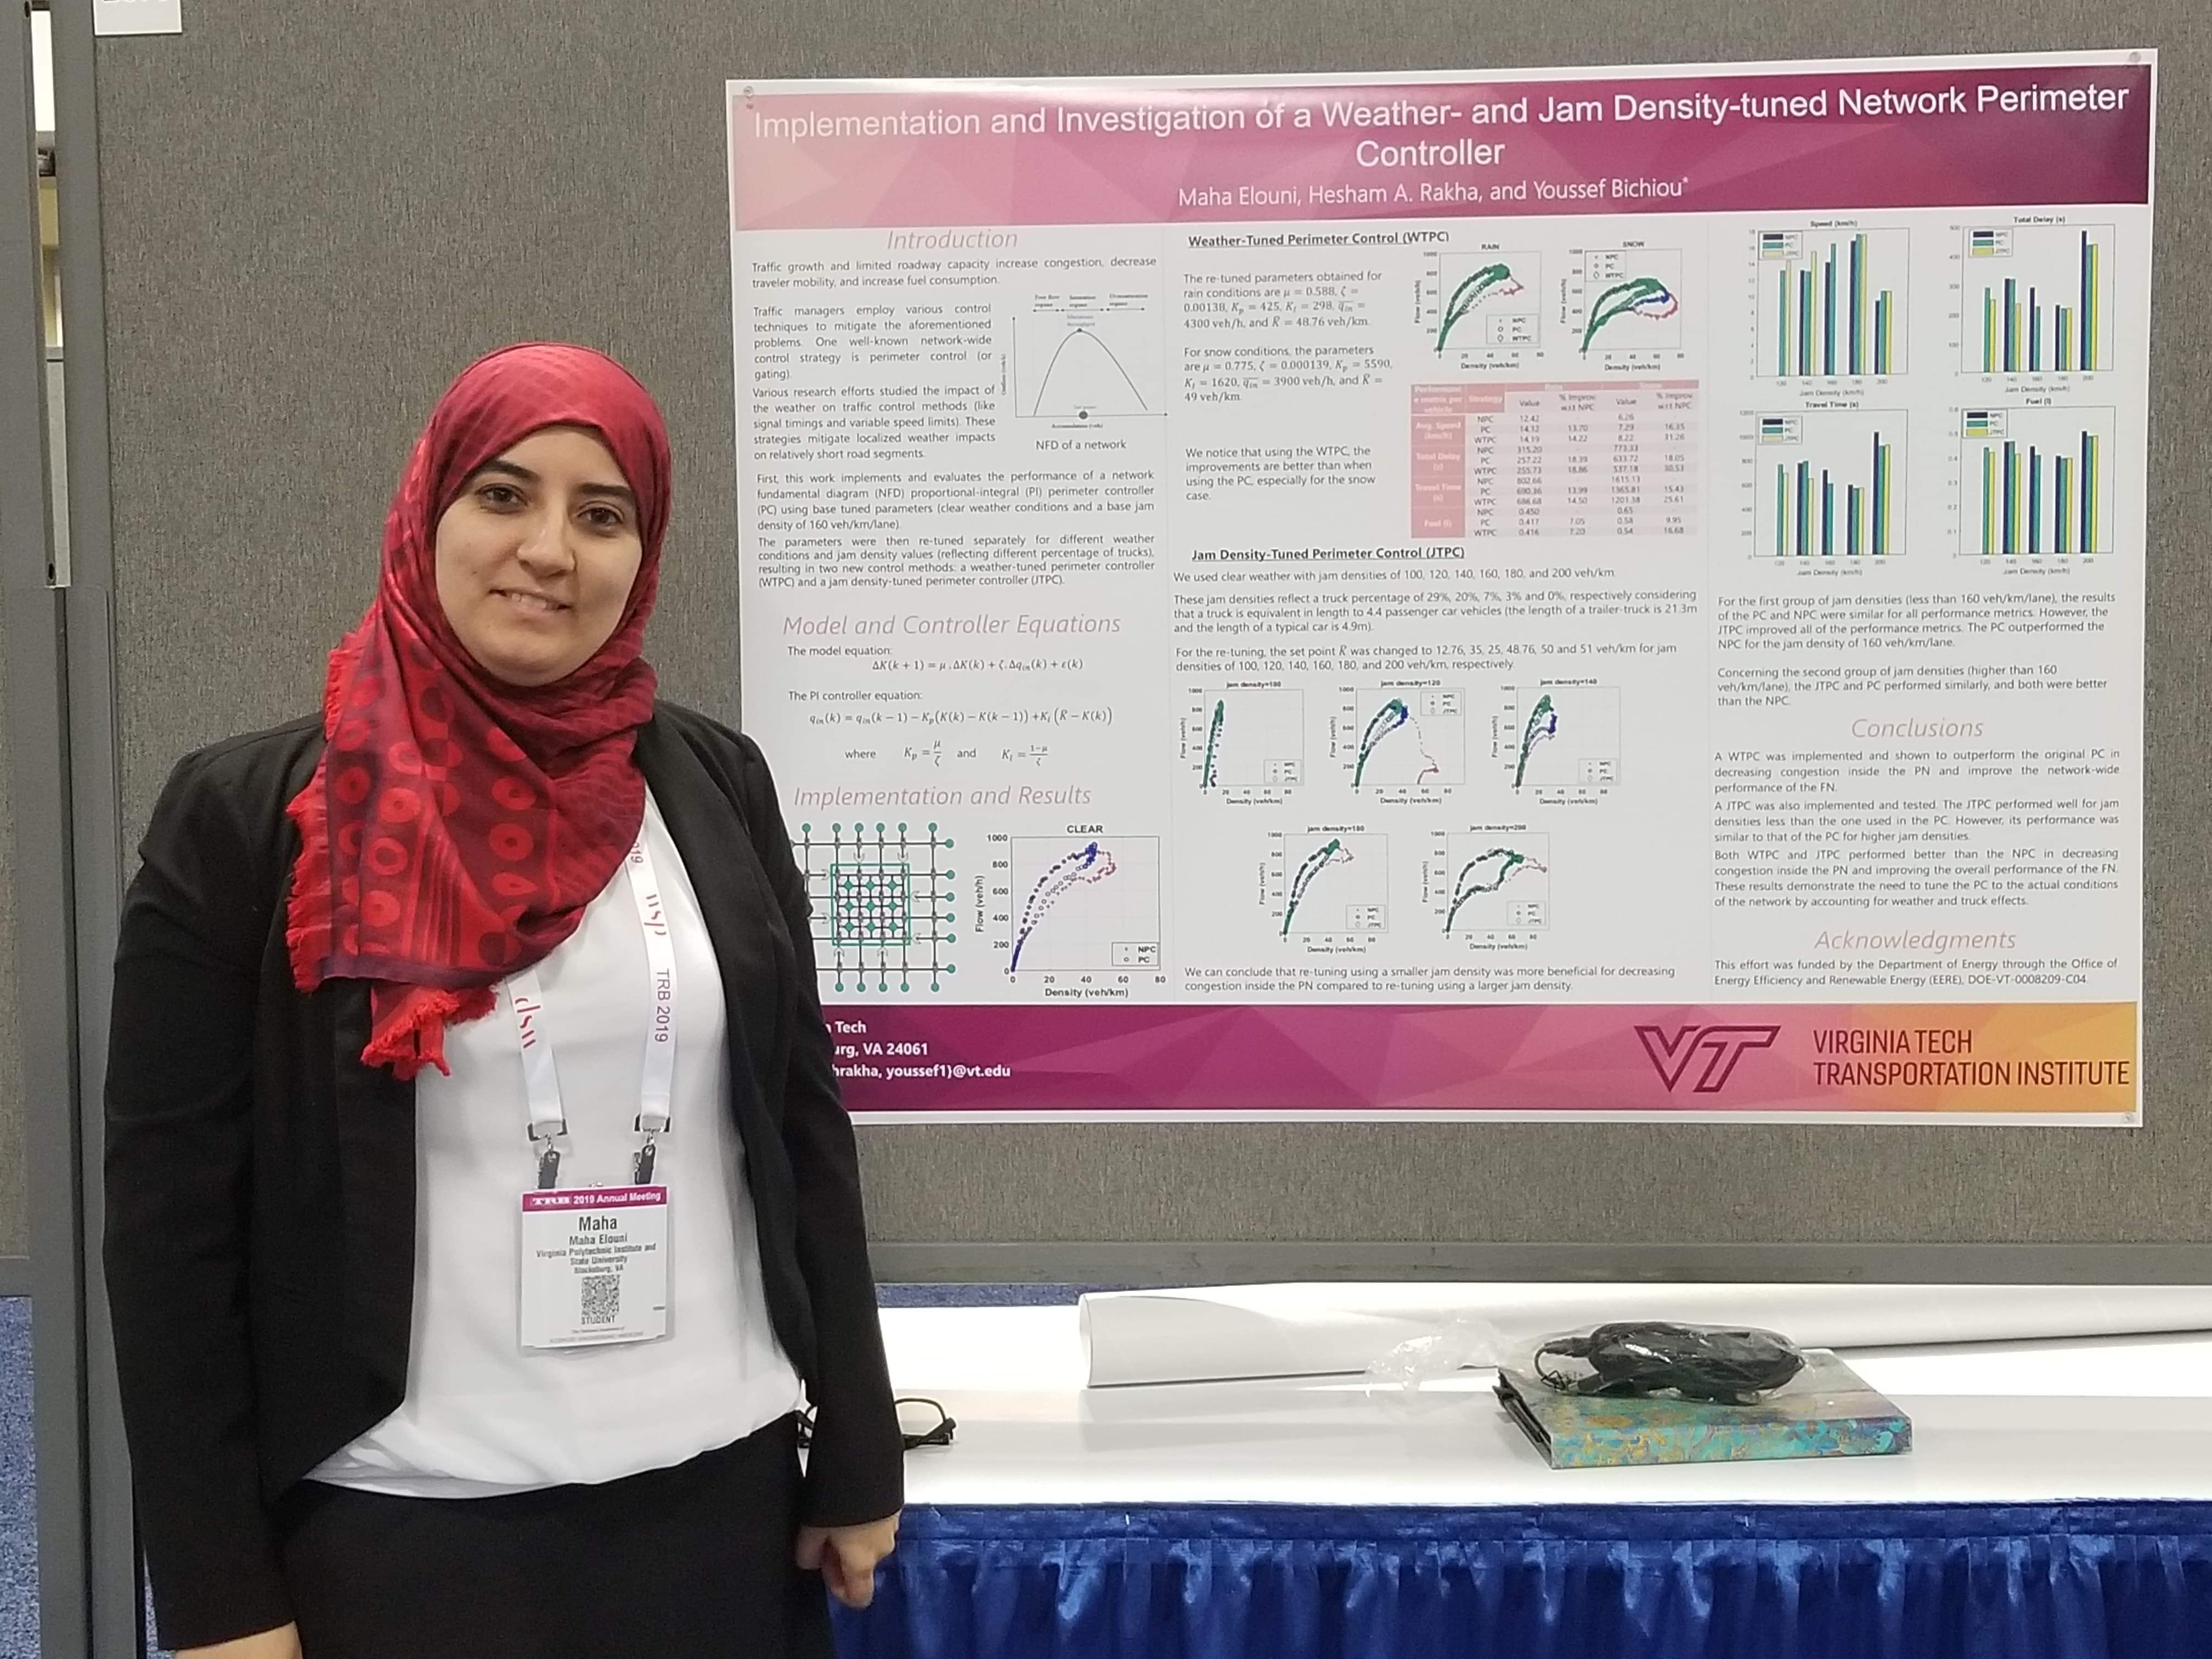
Meet Maha Elouni, a computer engineering PhD student at Virginia Tech working on just this problem.
Originally from Tunisia, Elouni’s interest started in the field of computer science, in which she received a master’s degree. Her work involved computer engineering and advanced research in sensor networks. Let me break that down: sensor networks work when individual sensors placed on a multitude of items are built into a large digital network so that they can communicate. For example, a GPS (global positioning satellite) sensor on the front bumper of every vehicle could be built into a network so that every vehicle could “talk” via its GPS to every other vehicle in the network.
Why does that matter? Who cares if my white Mazda can talk to that red Subaru? Elouni cares! Once the vehicles are able to communicate with each other, they can also be communicated to. As in, they can be given instructions. And this is where Elouni’s current research comes into play.
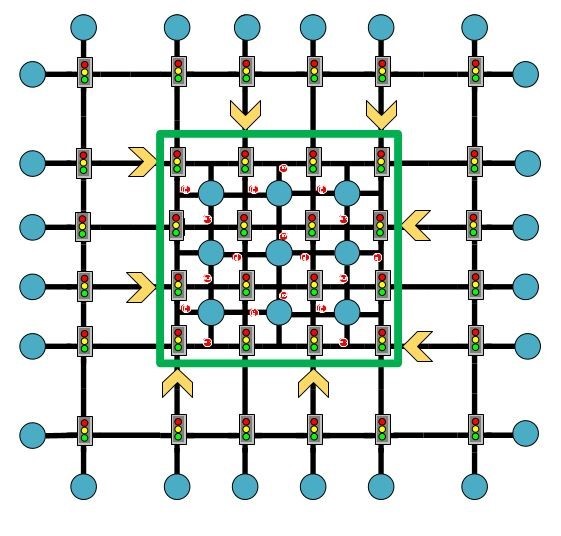
Having determined that it is possible to create the sensor networks, her research now focuses on theoretical models of the implementation of best-case scenarios. Combining traffic light data with traffic density and the sensors on the vehicles allows her to create a digital model that can control traffic light signaling as well as vehicle speed to maximize flow from one point to another. Simply put, her models are aimed at reducing traffic jams.
What does that look like in practice? Maybe I sit longer at this light than the next light, but that is only because the goal is to maintain a faster flow of traffic. Maybe I don’t travel as quickly from this point to the next light, but again, the goal is maintaining flow. The stop-and-start-race-to-the-next-light mantra we tend to adopt when in a hurry is terrible for an effective flow of traffic.
Computers can help by tracking the position of all vehicles at all times in all areas, and that is what Elouni’s research group is testing. As autonomous cars become a reality, there is potential for automating travel to minimize transit time, while maximizing flow.
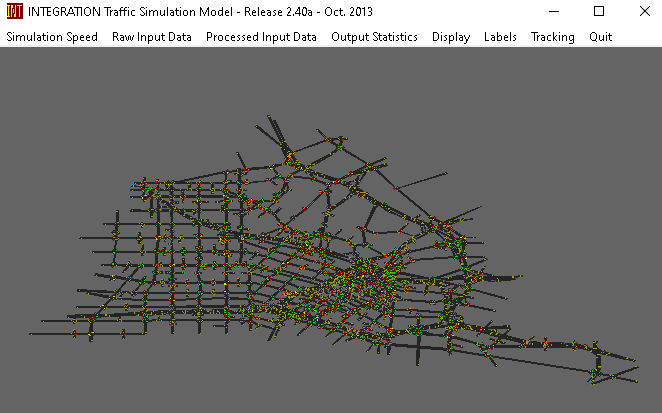
Elouni began her work with theoretical models on a small city scale, examining stop-and-go patterns as well as long-distance scenarios. But user-created models only go so far. Blacksburg has some traffic problems, but Elouni turned her attention to the gridlocks of a very big city: Los Angeles, Calfornia. Using LA city travel as a real-life example, Elouni combines input from highways with input from inner-city one-way and two-way streets.
How well does Elouni’s model work for reducing LA traffic snarls? That depends on how you define success. Under ideal situations, she has achieved up to 20 percent reductions in travel time. That may not sound like much, but if it takes an hour to make a commute, you could save 12 minutes. Coffee, anyone?
Thanks to Elouni and her research emphasis, we may one day live in a world with no traffic jams. But for now, well, I didn’t quite make it to Roanoke on time. If only I had saved that 12 minutes, I’d have a tuxedo for my wedding tomorrow.