

Masterclass Helps Participants Communicate Research Through Comics
May 18, 2023
Cartoons aren’t just something you find in the Sunday funnies. Comics can also be an engaging way to tell the story of your research.
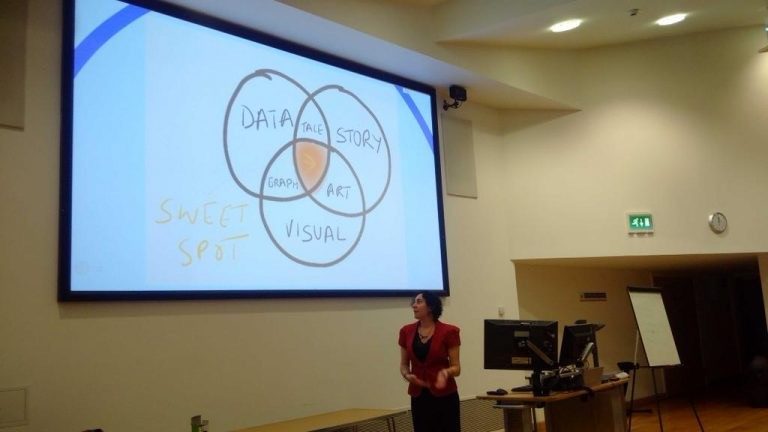
“Data Drawn: A Data Storytelling Workshop” was a two-day masterclass conducted March 28 and 30. The events were led by assistant professor Emmy Waldman of Virginia Tech’s English Department and visitor Anna Feigenbaum, a professor of digital storytelling from Bournemouth University.
During the Thursday session, Waldman and Feigenbaum discussed different types of comic narratives used for storytelling. The workshop began with a “squiggle game” warm-up activity in which one participant drew a random line on a piece of paper. Then a partner used their artistic interpretation to create an illustration with the line. With the creative juices flowing, participants then began thinking of what information they wanted to convey with their comics.
Although cartoons have often been associated with childrens’ entertainment or humor, American cartoonist, Art Spiegelman, emphasized their use in diagramming rather than comedy. They are an intersection of creative expression, Waldman said, and the inclusion of illustrations should be just as important as the inclusion of words.
Four-panel narratives, the speakers explained, are the most popular format today. They are ideal for phone screens in the age of social media and can tell a story concisely. Another format, which the speakers referred to as comic maps, are diagrams or pathways that tell a story chronologically or through setting-specific details.
The importance of storytelling with pictures has been an important concept throughout history. In medieval times, artists produced many maps, usually using images of dragons, that told the stories of war. Later, religious art told stories through the medium of stained glass windows which decorated churches and other powerful buildings. For decades, we have placed more of a focus on the written word – but, with the rise of TikTok, Instagram, and other social media applications, we are now moving back toward picture-based storytelling, the presenters said.
One of the most important aspects of storytelling, said Feigenbaum, is creating characters that are appropriate and relatable. Whether they are human or non-human, characters provide a lens within which the story is focalized.
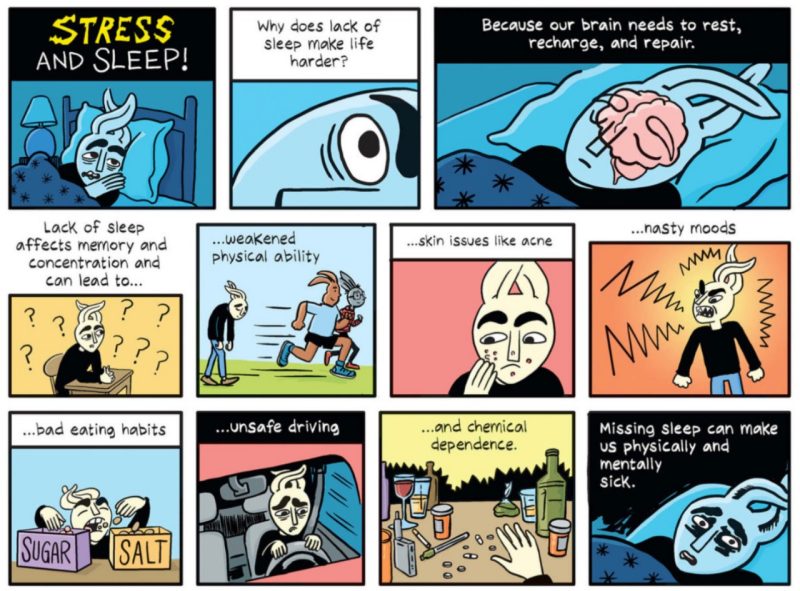
A benefit of using non-human characters is the ability to externalize what is usually intrinsic, Feigenbaum explained. One example is in Heart and Brain, a comic by Nick Seluk, in which cartoon depictions of human organs speak for themselves and reveal common worries of readers.
Another benefit of using comics for depicting data findings is the ability to maintain anonymity for the research subjects. Waldman has used this in her own research and explained how an emotional connection to a story can be preserved with the visual element, humanizing the research in a way that numbers often cannot.
Do comics always require a setting? While not always explicit from the background, Feigenbaum said, most comics include hints at the identities of the characters or the time period in which the story takes place. In comics set against white space — a completely blank background — the outfits of the characters are often telling of time and place.
Another unique element of comics is the use of visual metaphor. Visual metaphor acts as a way of showing inner worlds, describing feelings, and portraying emotions through exaggeration and illustration. Like using non-human characters, visual metaphors can bring the invisible to the forefront, such as when you personify bacteria or present a view from inside the ocean.
Regardless of the format, a data comic artist must be aware of their narrative, or how they structure their story. This process is not much different from the pacing of stories in short videos, the speakers said.
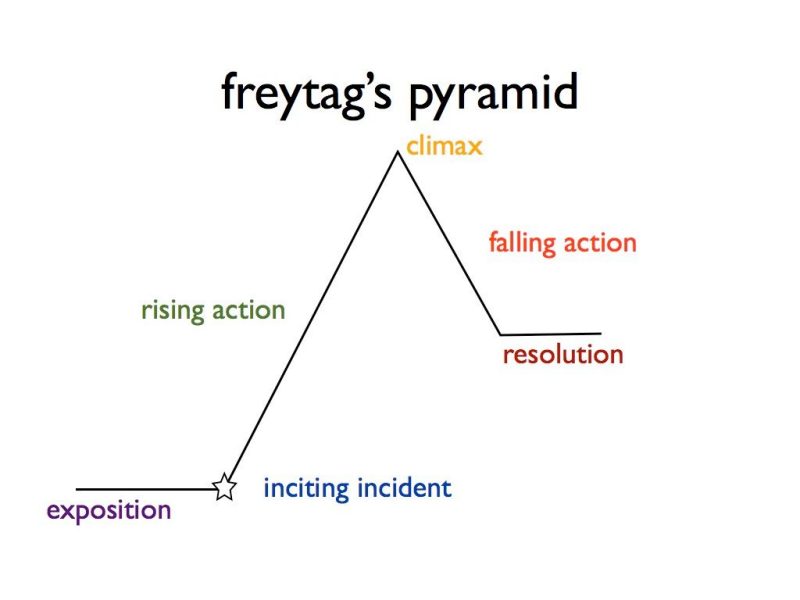
Freytag’s Pyramid, an instructive diagram containing the components of storytelling and how they should flow, is useful in both four-panel comics and comic maps. A few elements which are likely familiar to readers are exposition, climax, and resolution.
In a four-panel storyboard, the artist has more liberty to stretch out these elements. A common structure for this format includes the exposition and inciting incident in the first panel, introducing the conflict in the second, giving a possible resolution in the third, and concluding the conflict in the fourth and final panel.
Comic maps can contain all elements with only one panel, if done correctly. Artistic choices such as color, drawing different lines, and presenting “radiating” effects can alter the meaning and provide a clear interpretation of a story.
The activity in the latter part of the workshop consisted of participants drawing their own comics using conclusions from their own research or examples of data that were provided.
The Tuesday workshop focused on introducing the concept of using data comics to convey research; and, the third and final session, led by cartoonist Cara Bean, was an introduction to doodling and drawing paneled cartoons. Examples from all the workshops will be on exhibit at Newman Library at the end of fall semester along with other student work, and Bean's book "Let's Talk About It: A Graphic Guide to Mental Health" (illustration above) is available online for free.
By Quinn Richards, Center for Communicating Science graduate assistant